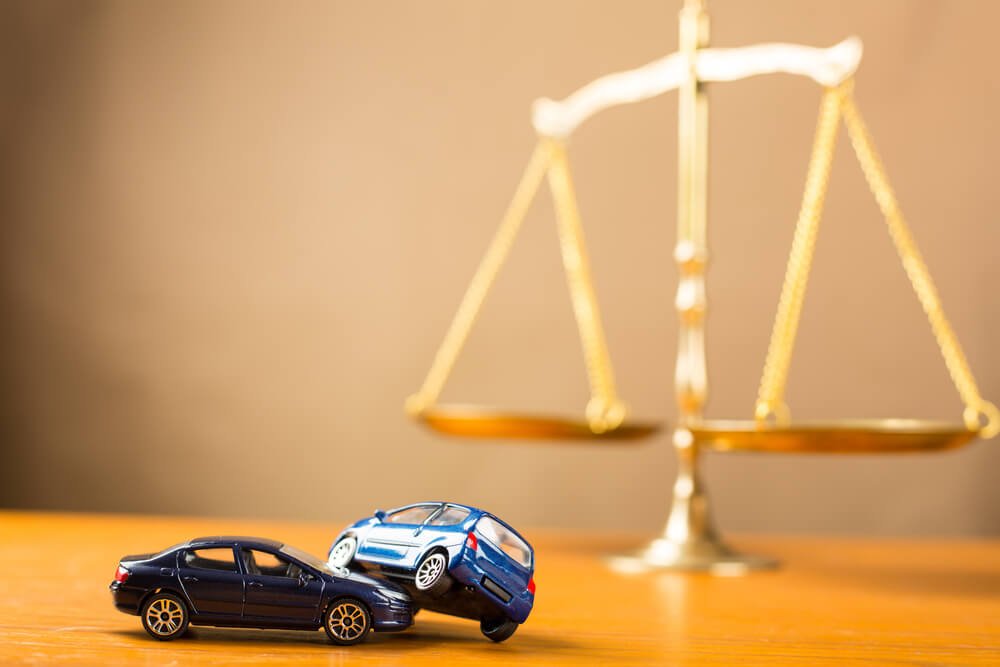
How is Fault Determined in Texas after a Car Accident?
The intricacies of determining which party is at fault in a car accident vary from state to state. However, in Texas state, fault in a car accident is usually established by checking the traffic laws and safety standards that either party violated. After that, a careful examination of the damages incurred follows. The following information explores how fault is established in the case of a car accident.
What is Termed Fault in A Vehicle Accident?
It might sound like a simple question; Simply the perpetrator of the accident. Suppose you are the one rear-ended at a spotlight. It’s a clear-cut case and easy to determine the fault as opposed to where blame has to go either way. Now imagine a case involving multiple cars with the drivers all pointing fingers. It’s no longer a cut and dry case anymore, and some steps have to be followed to know the real perpetrator(s).
It is usually the work of an insurance company to establish fault, but this is usually not that simple. Each insurer has its laws and therefore tackles claims and coverage differently.
What to Do If You Believe You Are Not the One at Fault
- If you can, have everything documented. Obtain contact details of the other driver(s) and witnesses.
- Seek medical attention even if you are feeling okay.
- Inform your insurance company.
- If you have already gotten them, keep all your repair bills, receipts, medical bills, and exchanges.
- Avoid settlement with insurance companies without involving an attorney.
Determination of Fault by the Police
After reporting an accident, the police officers investigate it and prepare a report with precise details of the crash. They, after that, interview the drivers and witnesses, if any, in a bid to knit together a comprehensive and accurate record of what had transpired. They will then submit the report to a higher department for further investigations.
A Car Accident Case That is taken to Court
Most accidents are neutralized outside the court. But, in some instances, if it finds its way to court, there will be a jury or judge who will rule out whether or not the defendant was the one negligent. The court does this by examining available evidence and weighing the arguments made by either parties’ lawyers.
Whoever the judge declares negligent is supposed to pay some money to cater for the losses and injuries sustained by the affected party during the accident. The court case’s outcome is specifically the court’s decision, independent of the police and insurance companies.
Why You Need To Hire an Attorney
The overwhelming situation after a car accident can leave you feeling helpless.
Handling the injuries, trauma losses, insurance companies, or even a lawsuit can be quite challenging. Fortunately, you don’t have to let all the weight fall on you alone.
If you have been involved in an accident, a good auto accident lawyer can offer you valuable information and legal advice. They will be at hand to protect your legal rights and ensure the statements you made to the insurance companies and the police are not put to use against you. The car accident lawyers at Angel Reyes & Associates have provided important additional information on how to determine fault after you have been involved in an accident: https://www.reyeslaw.com/frequently-asked-questions/how-is-fault-determined-in-a-car-accident-case-in-texas/